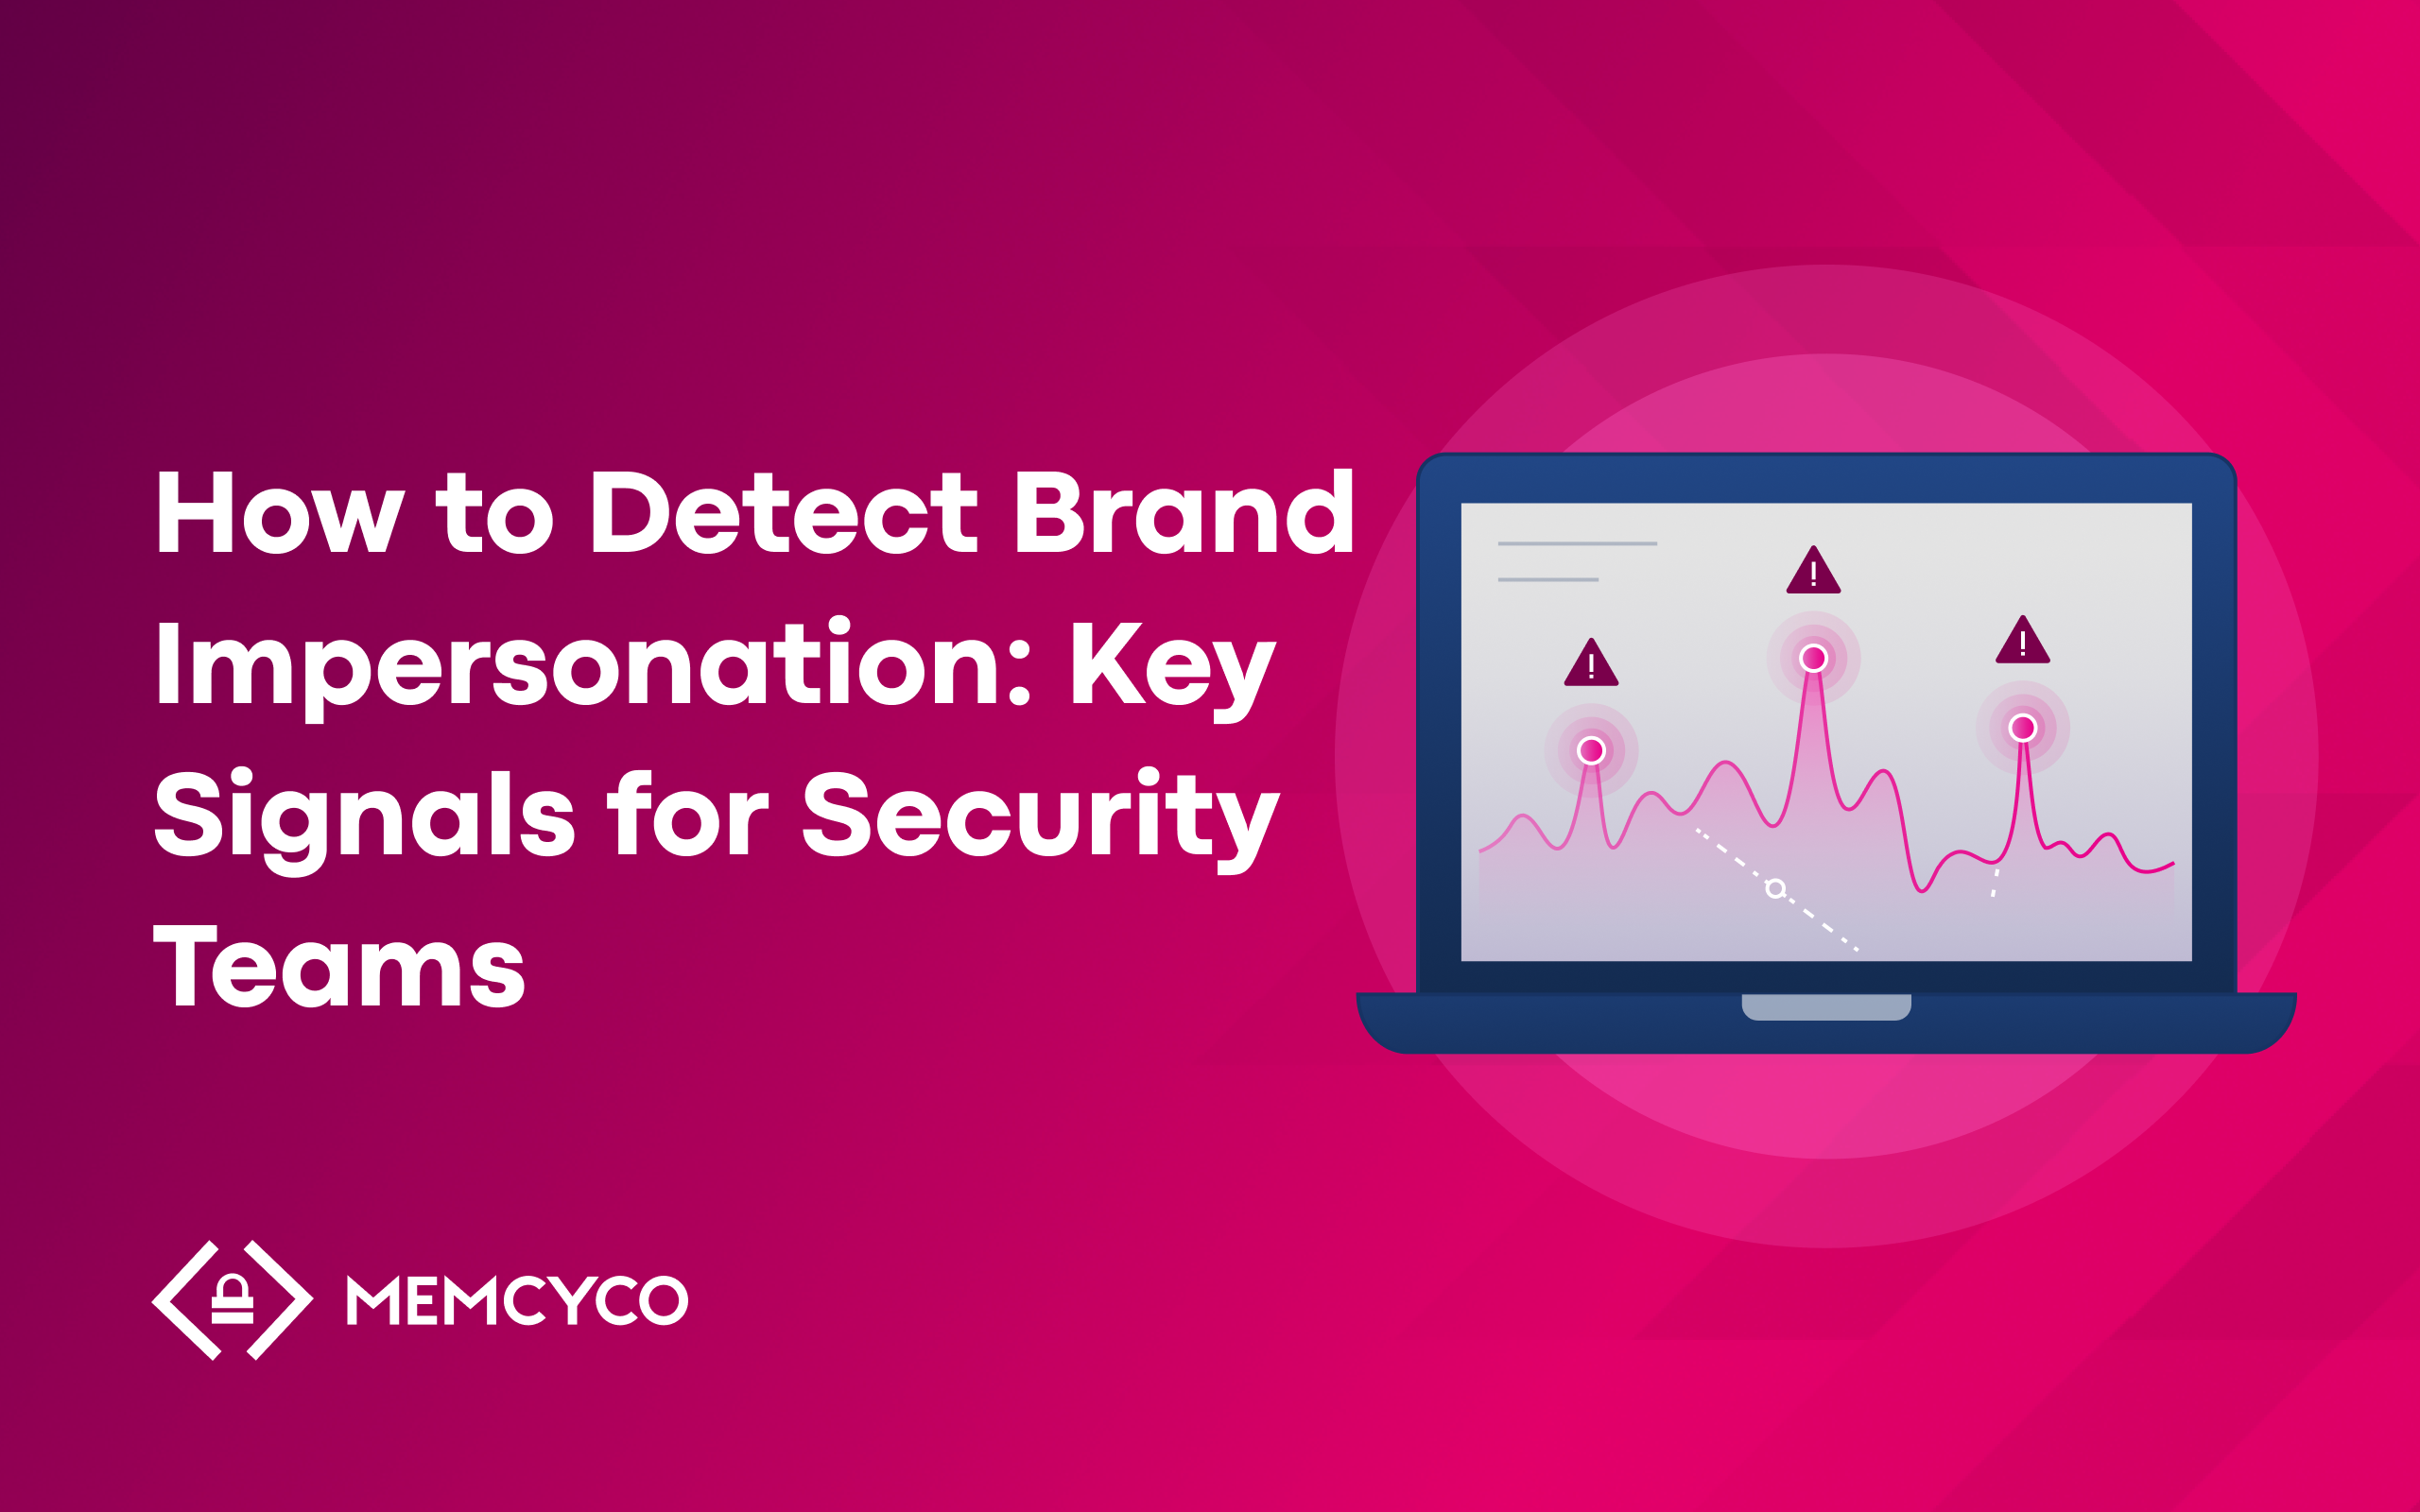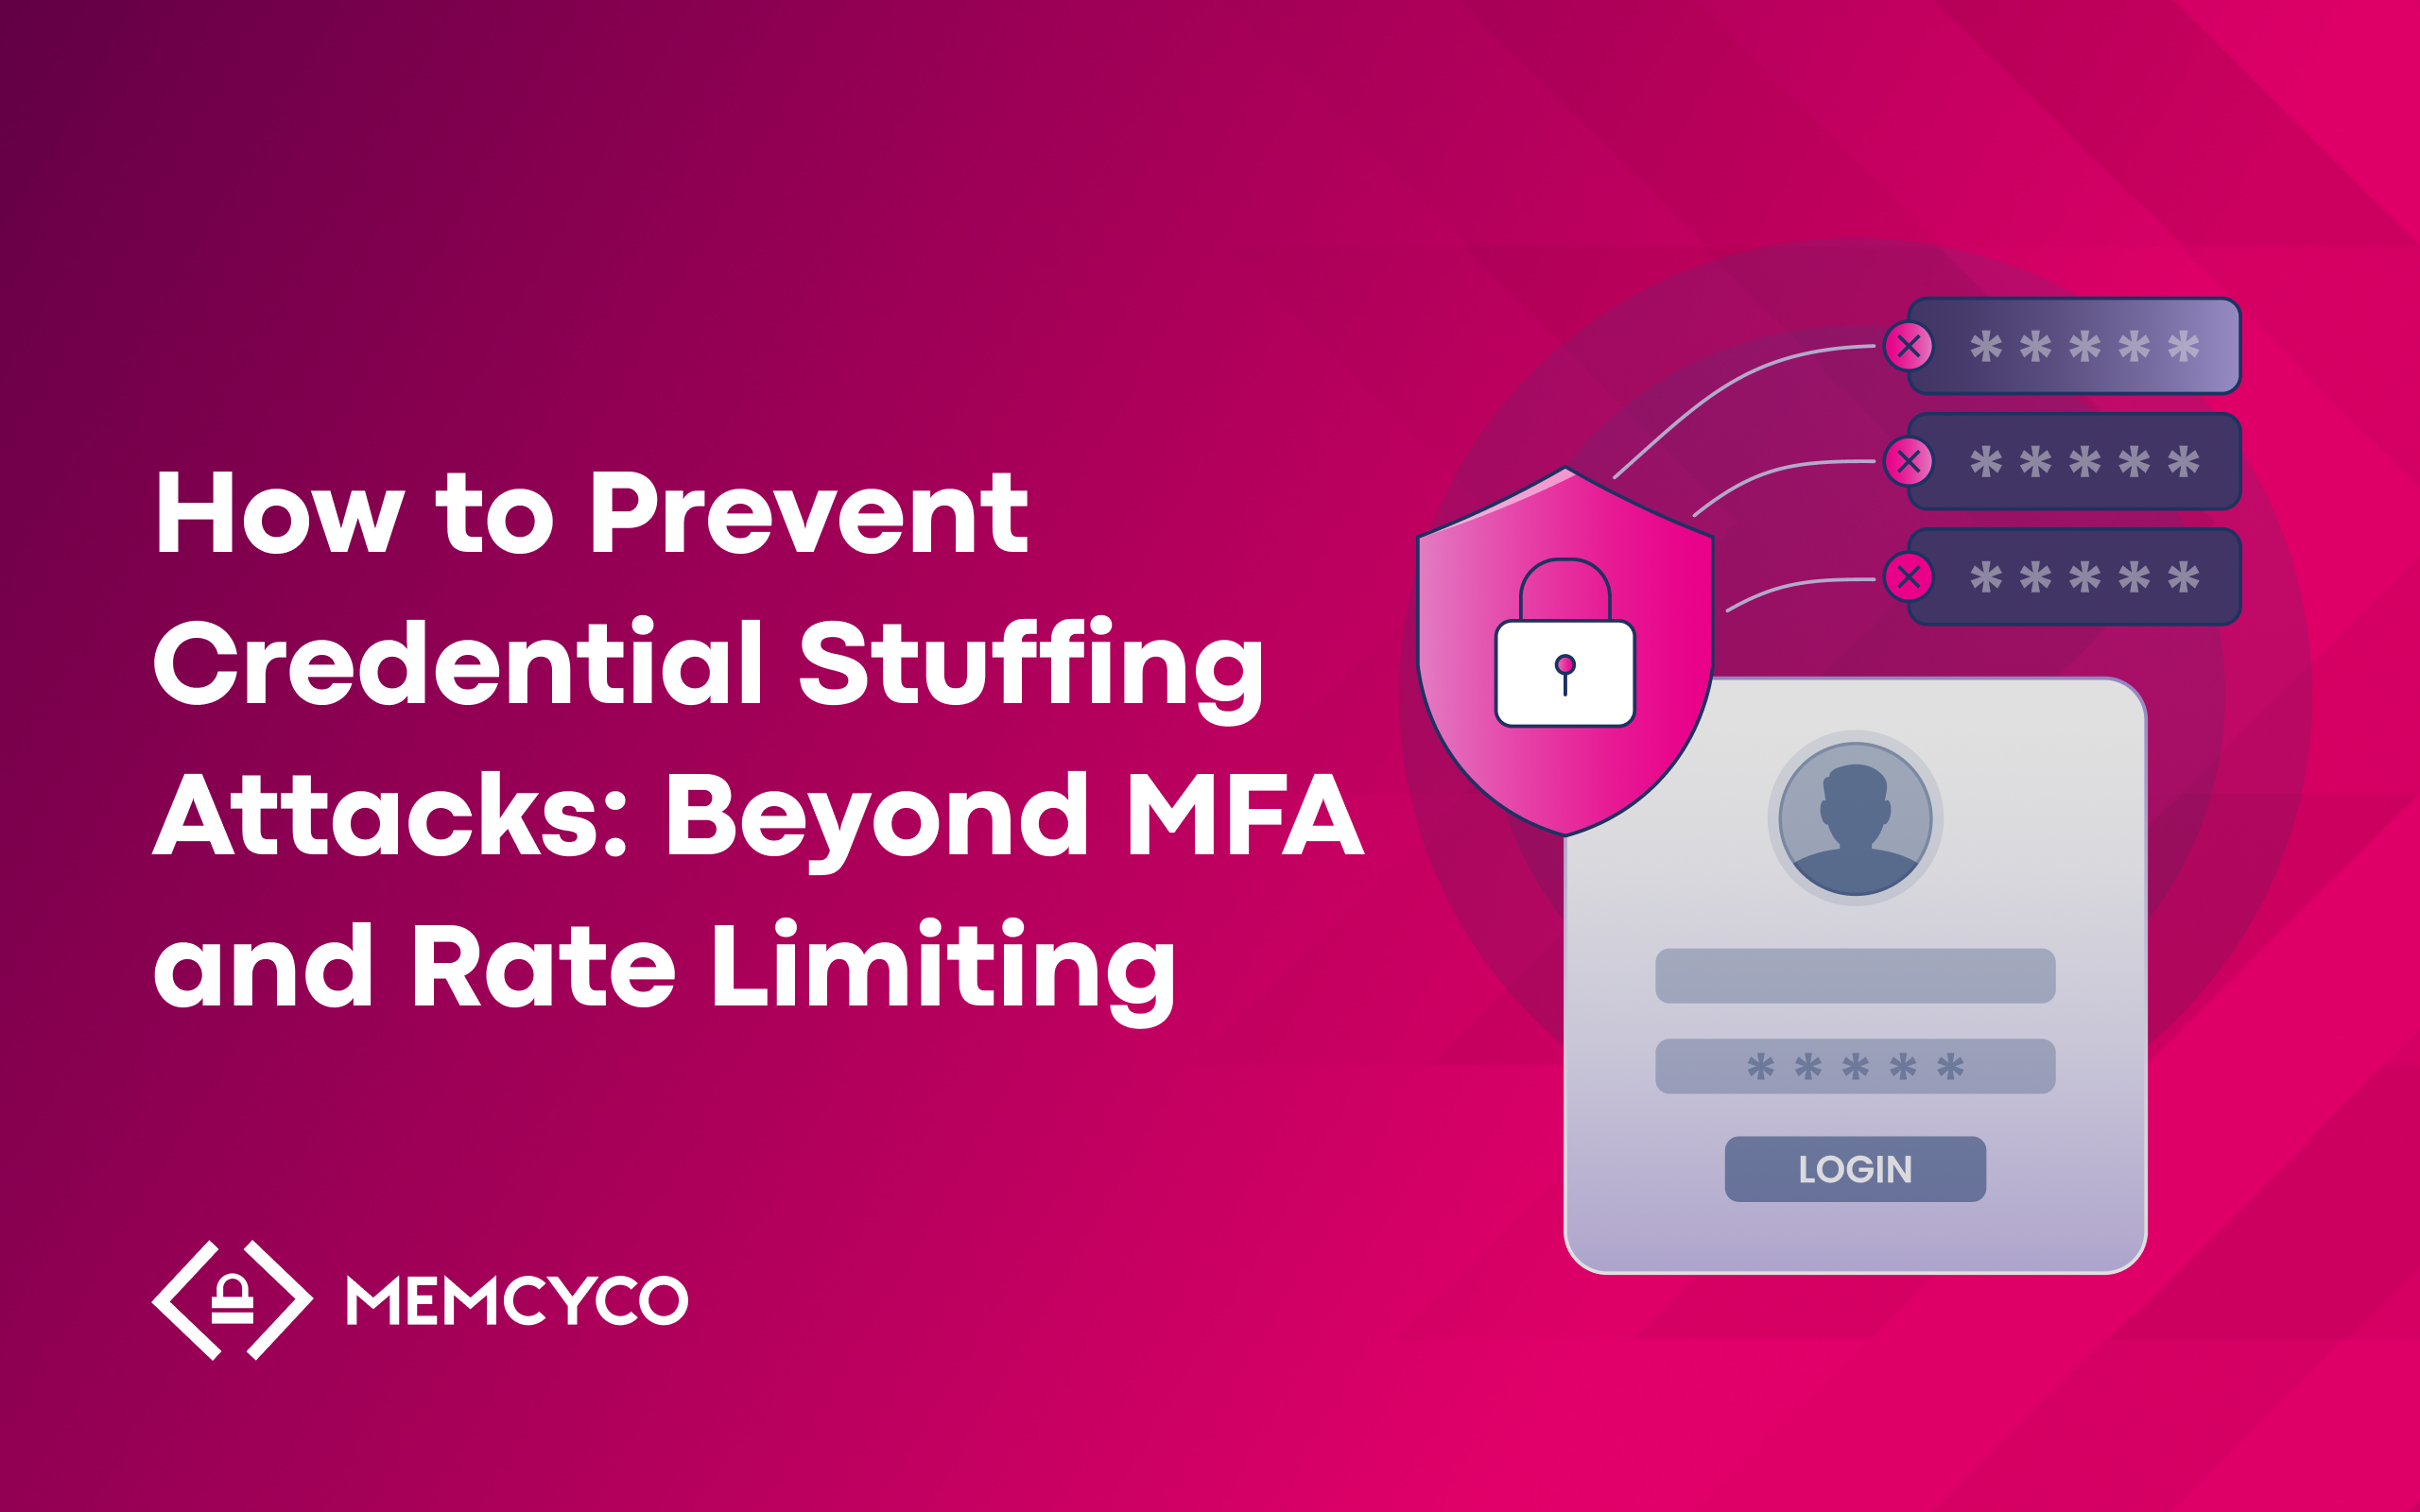
Introduction
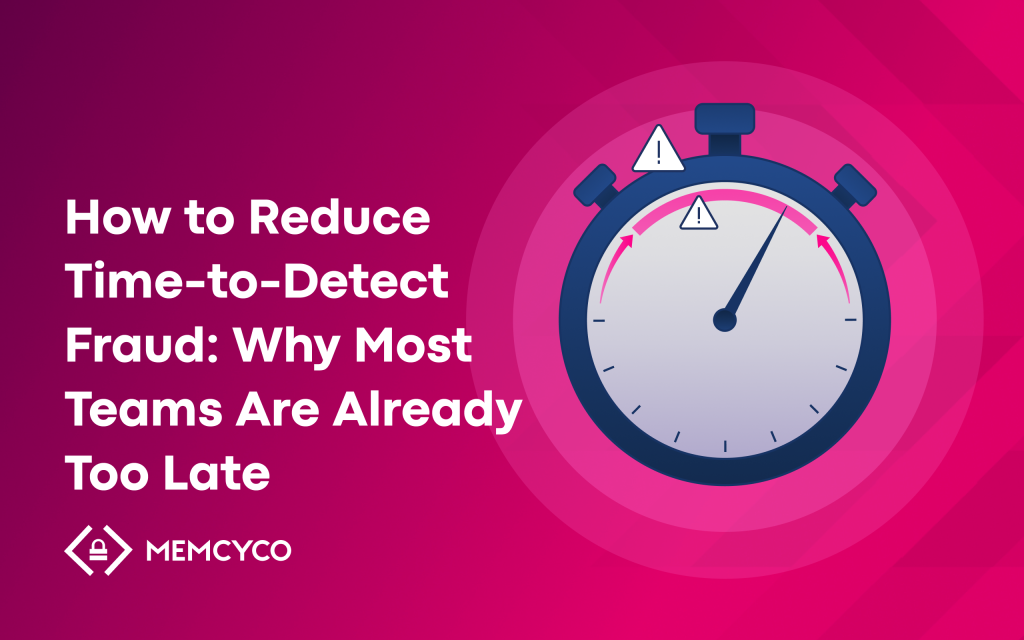
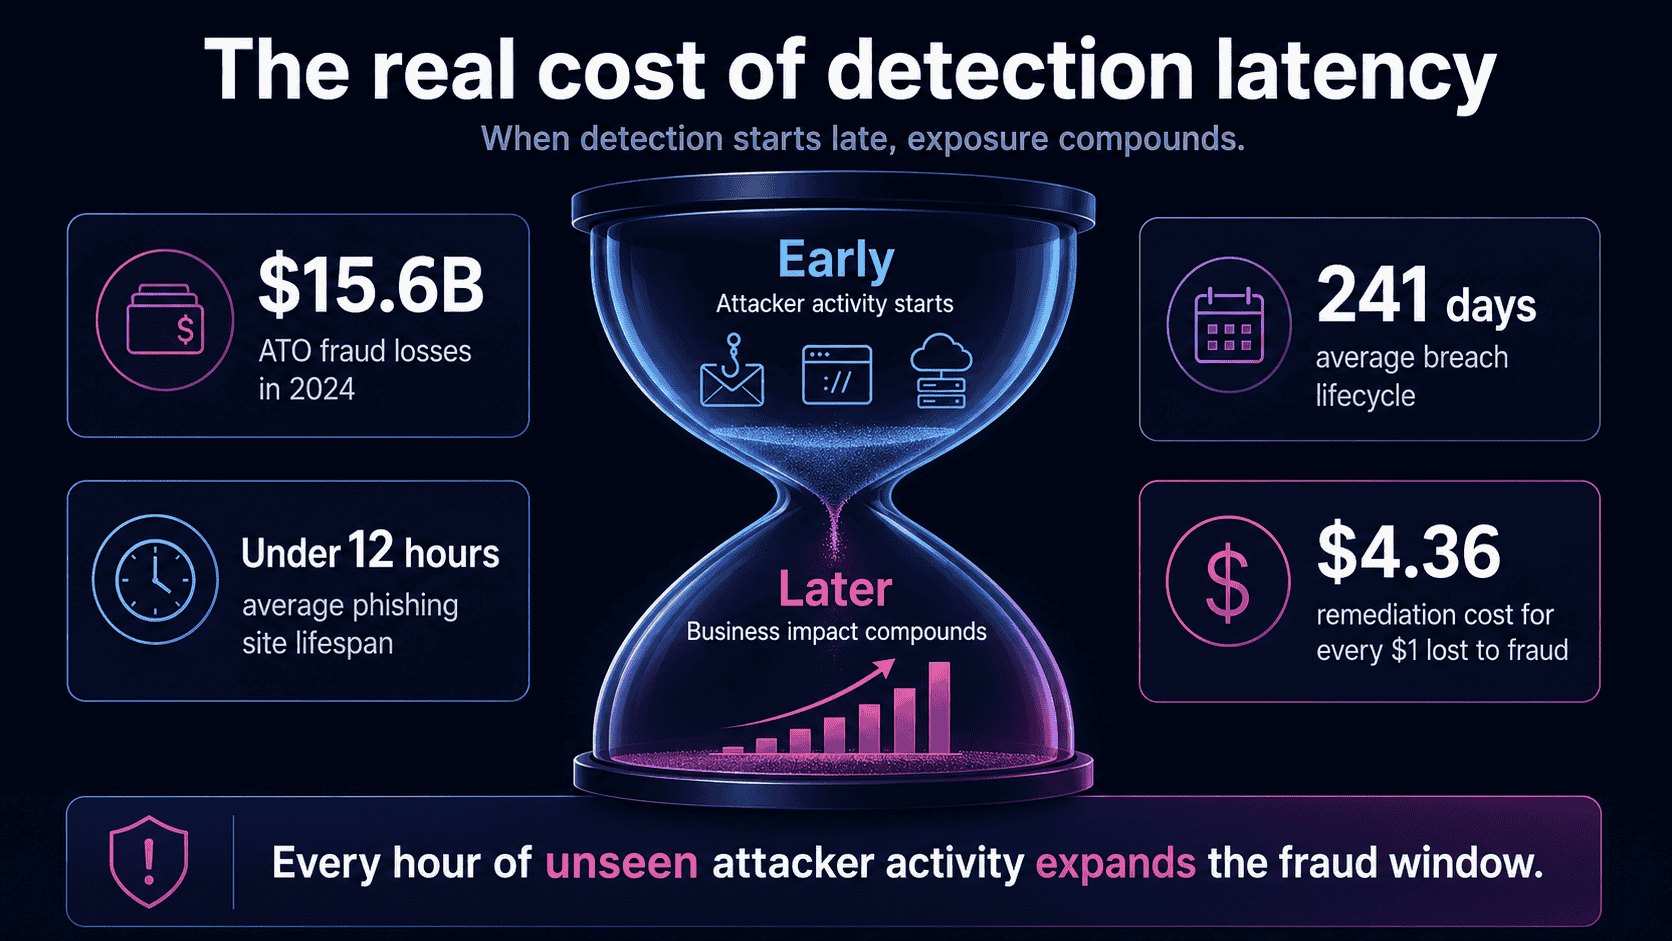
ATO fraud cost US adults $15.6 billion in 2024, yet most fraud teams are still measuring detection time from the moment an alert fires, not from the moment an attacker starts building infrastructure. That gap is where the damage happens.
To reduce time to detect fraud, teams need to move detection upstream, to Stage 1 and Stage 2 of the fraud lifecycle, before phishing sites go live and before a single credential is submitted. Faster transaction monitoring won’t close this gap. Structural change in where detection starts will.
This article breaks down why traditional detection is built to be late, how the fraud lifecycle creates the real MTTD problem, and six concrete steps to shift detection earlier, including the metrics that tell you whether it’s actually working.
Introduction: The Clock Starts Earlier Than You Think
By the time your transaction monitoring system fires an alert, the attacker is already gone.
They’ve registered the domain, cloned your brand, stood up the fake login page, sent the phishing campaign, and harvested the credentials. The fraud didn’t start when the anomalous transaction hit your queue. It started days, sometimes weeks, before that. Your detection clock was already running. You just weren’t watching it.
This is the core problem with how most fraud and risk teams measure, and try to reduce, mean time to detect (MTTD). The tooling is sophisticated. The investment is real. But it’s pointed at the wrong stage of the attack.
The numbers are hard to ignore. Account takeover fraud cost US adults approximately $15.6 billion in 2024, a 23% increase year-over-year, according to Feedzai, citing Javelin Strategy & Research. Globally, INETCO reports that digital fraudsters stole over $1 trillion in 2024. These losses aren’t happening because teams lack detection tools. They’re happening because detection starts too late in the account takeover fraud chain.
Reducing MTTD is not a tooling problem. It’s a lifecycle problem.
The fastest way to shrink detection time isn’t a faster transaction scoring engine. It’s moving detection upstream to where attacks actually begin: infrastructure setup, brand impersonation, and credential harvesting. That’s Stage 1 and Stage 2 of the fraud lifecycle. Most teams don’t gain visibility until Stage 4 or 5, when the damage is already done.
This article gives fraud and risk professionals a concrete framework for understanding where detection latency comes from, and how to reduce it by shifting detection earlier in the attack lifecycle.
What Is Mean Time to Detect (MTTD) in Digital Fraud?
Most fraud teams track MTTD. Far fewer agree on what the clock is actually measuring.
In digital fraud, mean time to detect (MTTD) is the average elapsed time between the moment an attacker begins executing an attack and the moment your organization gains awareness of it. That’s an attack-layer metric. It measures the gap between what the attacker is doing and what you can see. Every hour inside that gap is an open window: credentials harvested, accounts accessed, transactions initiated, customers exposed.
This is not the same as the detection timescales found in occupational fraud research. The ACFE 2024 Report to the Nations found that the median occupational fraud case takes 12 months to detect. That figure reflects internal fraud uncovered through tips and audits. It’s an audit-layer metric, operating on a completely different timescale from the externally initiated digital attacks targeting your customers.
Digital fraud moves faster. Much faster.
Phishing sites have an average lifespan of under 12 hours before takedown, according to the BlackBerry 2025 Global Threat Intelligence Report. Attackers build, deploy, and harvest credentials within a single working day. Yet the IBM Cost of a Data Breach Report 2024 found that phishing-related breaches take an average of 261 days to identify and contain.
Attacks that execute in hours take nearly nine months to detect.
That gap is your financial exposure window. The longer MTTD runs, the more victims submit credentials to attacker-controlled pages, the more accounts are compromised, and the more fraudulent transactions clear before a single alert fires. Detection latency isn’t a compliance metric. It’s a direct multiplier on fraud losses.
So if MTTD measures the gap between attacker action and defender awareness, what actually drives it, and why does it stay so wide even for teams with mature detection controls?
MTTD vs. Dwell Time: Understanding the Terminology
These three terms get used interchangeably. They shouldn’t be.
- MTTD (mean time to detect) is a metric: the average time elapsed between an attack occurring and your team registering a first alert. It’s a number you can calculate, track, and benchmark,
- Dwell time is the lived reality behind that number. It’s how long an attacker operates undetected against your environment or your customers. According to the Verizon 2025 Data Breach Investigations Report, dwell time varies significantly by attack type and detection method, with non-actor-disclosed breaches showing the longest gaps.
- Fraud detection latency is the structural condition that produces both. It’s the gap between what attackers are doing and what your controls can see.
Here’s where most fraud teams get the measurement wrong: in digital impersonation fraud, dwell time doesn’t start when a transaction is attempted. It starts when an attacker registers a lookalike domain or clones your brand assets. That can be days or weeks before a single credential is harvested.
Most teams measure MTTD from alert to investigation. The actual clock started long before that.
Why Traditional Fraud Detection Is Structurally Slow
You’ve tuned the rules, built the queues, and hired the analysts. Fraud losses are still climbing. That’s not a failure of effort. It’s a structural flaw baked into how transaction-layer detection was designed to work.
Here are the five root causes of detection latency that most fraud teams already feel but rarely see named directly.
- 1. Transaction-based triggers only fire after execution
Transaction monitoring analyzes what has already happened. By the time a rule fires on a suspicious transfer, a login anomaly, or a mismatched device, the fraud attempt is done. The signal is real, but it’s a receipt, not a warning. Detection at this layer is structurally post-execution, which means MTTD can never fall below the moment of transaction initiation, regardless of how fast your rules run.
- 2. Post-event workflows add hours before investigation begins
Even when an alert fires immediately, the investigation clock doesn’t start at the same time. Alerts queue. Cases get assigned. Analysts pull context from multiple systems. The gap between alert generation and active investigation routinely stretches into hours, sometimes days for lower-priority flags. That window is time an attacker uses to move funds, harvest more credentials, or pivot to new accounts.
- 3. Manual investigation bottlenecks can’t match automated attacks
Fraud attacks scale automatically. Investigations don’t. Castellum.AI reports that analysts across banks and fintechs clear hundreds of alerts daily, with each review taking five minutes or more under manual workflows. Reviewing 100,000 alerts per month at that rate consumes over 8,000 labor hours. Attackers running automated credential-stuffing campaigns don’t wait for the queue to clear.
- 4. Alert fatigue degrades genuine signals
Rule-based systems cast wide nets. The result is a false positive problem that’s now industry-wide: Castellum.AI notes that nearly 95% of alerts reviewed by compliance analysts turn out to be false positives. When analysts spend their days clearing noise, real signals get buried, not out of negligence, but because the system has trained them to expect noise. Alert fatigue doesn’t just slow detection; it increases the probability that a genuine fraud signal gets dismissed.
- 5. Rule-based tuning lag creates a permanent detection gap
Detection rules are calibrated to known attack patterns. When attackers shift tactics, new phishing infrastructure, modified session behavior, rotated credential sources, existing rules don’t catch it until analysts identify the gap, escalate it, and push updated logic through testing and deployment. That cycle takes weeks. Fraudsters move in hours. As Castellum.AI puts it, institutions are “trying to mitigate 2025 risks on 2010 detection systems.”
Transaction monitoring is a necessary control layer. But it’s structurally downstream, designed to detect fraud after it’s been attempted. That design constraint means it cannot, by definition, reduce MTTD below the point of transaction execution.
The answer lies in where the fraud lifecycle actually begins, and where detection currently has no visibility at all.
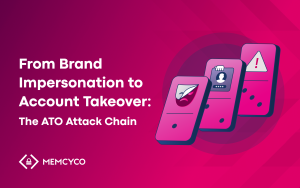
The Digital Fraud Lifecycle: Where Detection Actually Starts (and Where It Should)
Most fraud teams think the attack clock starts when a suspicious transaction fires. It doesn’t. By that point, the attacker has already done the hard work.
This lifecycle model applies specifically to externally initiated digital fraud involving impersonation and credential compromise. It doesn’t describe insider fraud, synthetic identity schemes, or mule networks. Those are different problems with different detection logic.
What it does describe is the attack pattern behind phishing, brand impersonation, and account takeover, the fraud types where detection latency does the most financial damage.
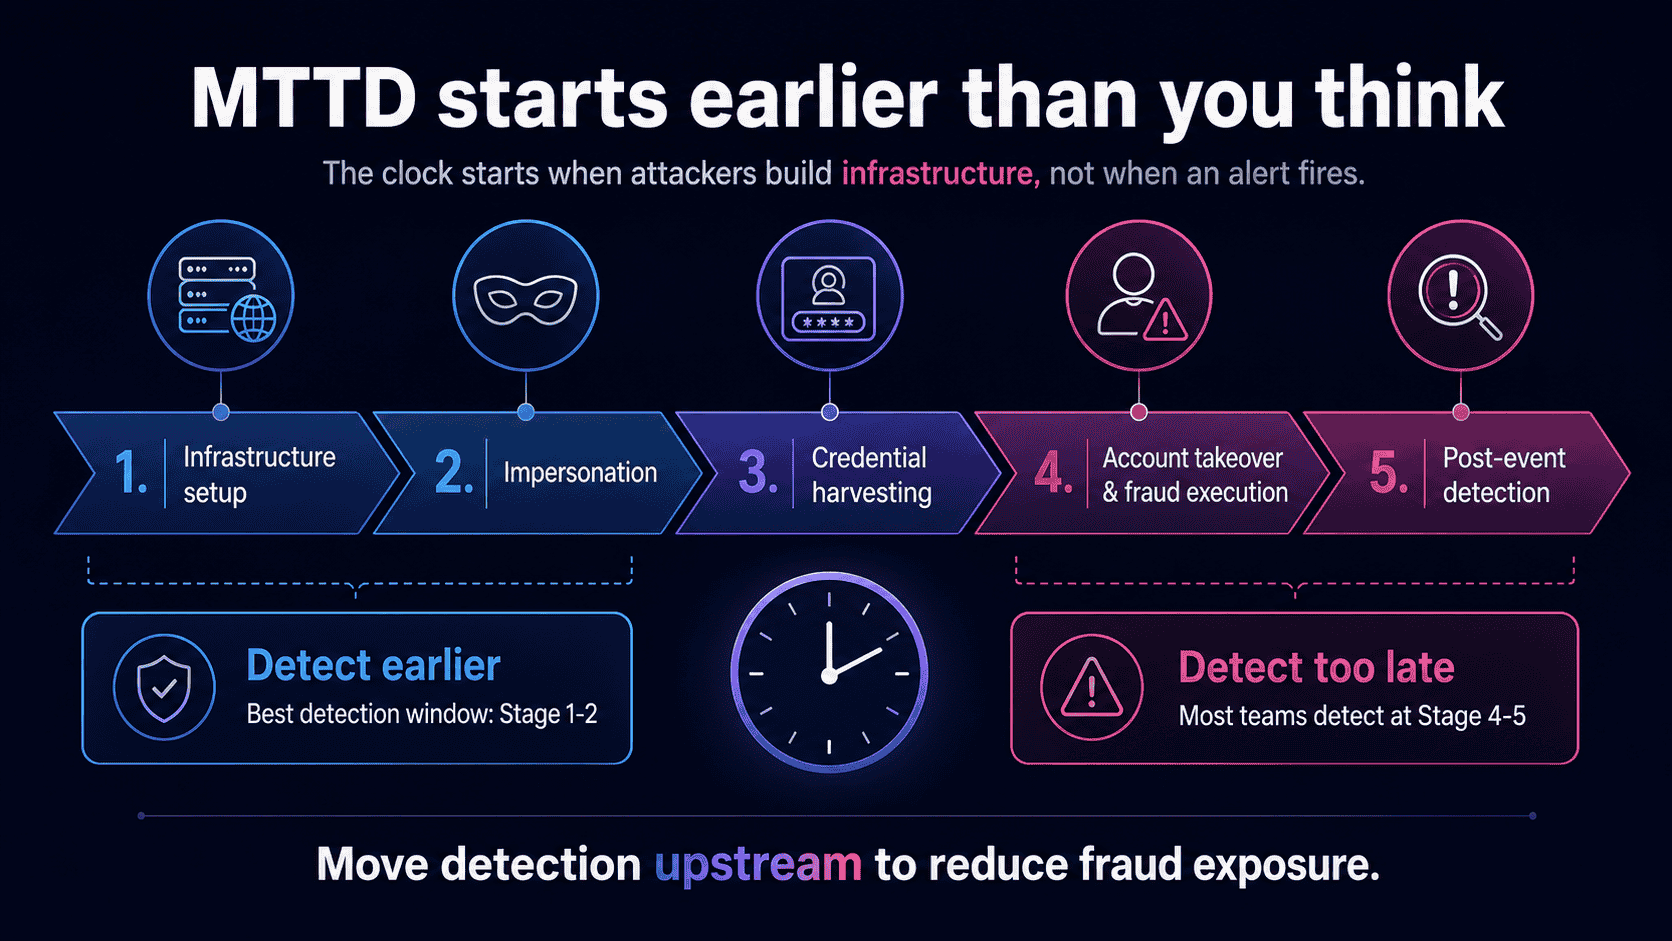
The model has five stages: Infrastructure Setup, Impersonation, Credential Harvesting, Account Takeover and Fraud Execution, and Post-Event Detection. The critical insight is this: the detection window shrinks the further downstream you move. Most teams only gain visibility at Stage 4 or 5, by which point the attacker has already completed the most damaging phases. The Verizon 2025 DBIR confirms the median time to report a phishing email is 28 minutes, giving attackers a head start that compounds at every stage.
Stage 1: Infrastructure Setup: The Attack Begins Before You Know It Exists
The attack clock starts here. Not at the suspicious transaction. Not at the account takeover alert. Here, when an attacker registers a lookalike domain, acquires an SSL certificate, and clones your brand’s UI, logos, and copy into a convincing fake site.
This stage is completely invisible to transaction monitoring. No payment has moved. No credential has been submitted. Nothing has triggered a rule. Yet the infrastructure for a full-scale impersonation attack is already live.
The speed is uncomfortable. Modern phishing-as-a-service (PhaaS) toolkits automate domain generation, subdomain deployment, and credential-harvesting page setup with minimal human input. Cofense’s 2026 threat intelligence report found that AI-enabled phishing kits now launch campaigns at one malicious attack every 19 seconds. Infrastructure that once took hours to build now takes minutes.
The detection opportunity at Stage 1 is real, but narrow:
- Domain registration signals – lookalike domains registered days or hours before a campaign launches
- SSL certificate issuance patterns – free certificates issued to newly registered brand-adjacent domains
- Brand asset similarity scanning – cloned logos, page structure, and copy flagged before the site goes live
- Infrastructure fingerprinting – hosting patterns and registrar behavior linked to known attacker toolkits
Detect here, and MTTD is measured in hours. Miss this window, and the attack moves to Stage 2 before you’ve seen a single signal.
Stage 2: Impersonation: The Fake Site Goes Live
The clone site is live. Phishing campaigns are already running across email, SMS, and social media, all pointing victims to an attacker-controlled page that looks exactly like yours.
The math is brutal. According to the BlackBerry Global Threat Intelligence Report, the average phishing site has a lifespan of under 12 hours. That’s not 12 hours to respond. That’s the entire window between the site going live and it being replaced or abandoned, often after credential harvesting is already underway.
Detection opportunities at Stage 2 include:
- Real-time website monitoring that surfaces clone sites and spoofed brand assets the moment they appear
- Phishing campaign signal monitoring across email and social channels, catching lures before they reach scale
- Digital impersonation detection that identifies fraudulent infrastructure while it’s still active
Stage 2 is the last point where you can warn customers before a single credential is submitted. Detection here doesn’t just cut fraud losses. It stops victims from becoming victims in the first place.
Once the lures land and victims click, you’re already at Stage 3.
Stage 3: Credential Harvesting: Victims Are Already Compromised
By Stage 3, the damage is done, even though nothing has hit your transaction monitoring yet.
Victims land on the attacker’s cloned site and hand over their credentials. They don’t know it’s fake. According to the Verizon DBIR 2025, the median time to click a phishing link is just 21 seconds. Credential compromise happens fast, silently, and entirely outside your perimeter.
The attacker now holds valid, working credentials. They can use them immediately, hold them, or sell them. The exposure window stays open indefinitely.
Most organizations have zero visibility at this stage. Their detection tools, behavioral analytics, session monitoring, and transaction rules, are all pointed inward at their own systems. Nobody is watching the attacker-controlled page where credentials are being collected in real time.
The narrow detection opportunities that exist at Stage 3 include:
- Behavioral anomalies in session data after the victim returns to your legitimate site
- Cross-channel signal correlation flagging unusual login patterns
- Real-time victim identification, if the organization has visibility into who is interacting with impersonating assets
That last capability is rare. Without it, Stage 3 is a blind spot, and the attacker knows it.
Stage 4: Account Takeover and Fraud Execution: The Transaction Layer Finally Fires
Stage 4 is where most fraud teams finally see something. The attacker logs in using harvested credentials, initiates unauthorized transactions, changes account details, or monetizes access through transfers, refunds, or loyalty point redemption. Transaction anomalies fire. Impossible travel flags trigger. Device fingerprint mismatches and velocity checks light up the dashboard.
The alerts are real. The timing isn’t.
By the time Stage 4 detection fires, the attacker has already cleared three stages undetected. Infrastructure was built. Impersonation pages went live. Credentials were harvested. The financial exposure window has been open for hours, days, or weeks before a single alert appears in your queue.
This is the structural trap of transaction-layer detection: it’s accurate, but it’s downstream. You’re catching the attacker at the point of monetization, not at the point of attack setup.
The scale of that damage is significant. According to Javelin Strategy & Research, account takeover fraud alone drove nearly $16 billion in losses in 2024. That figure reflects what happens when detection consistently starts at Stage 4.
Transaction monitoring isn’t the problem. Starting the clock there is.
Stage 5: Post-Event Detection: The Investigation Begins After the Damage
Stage 5 is where most fraud teams live. A transaction anomaly fires, an analyst opens a ticket, the fraud is confirmed, the customer is notified, and the reimbursement is processed. Then comes the documentation, the regulatory reporting, and the post-mortem.
This is the highest-cost, lowest-leverage point in the entire lifecycle.
By the time Stage 5 begins, the financial exposure has already materialized. The attacker is gone. The credentials are spent. The money has moved. What’s left is cleanup, and cleanup is expensive. According to LexisNexis Risk Solutions, U.S. financial institutions spend $4.36 in remediation costs for every dollar lost to fraud, once investigation, legal fees, and recovery workflows are factored in.
The operational drag is just as damaging. Incident handling at Stage 5 typically burns dozens of analyst hours per case. One CISO at a top-10 North American bank reported that Memcyco cut their incident handling time from 72 hours to under one hour, not by speeding up the investigation, but by moving detection upstream so fewer incidents reached Stage 5 at all.
That’s the insight this lifecycle model builds toward: the detection window shrinks the further downstream you move. Every stage you move upstream, you recover hours or days of detection time, and prevent financial exposure from materializing in the first place.
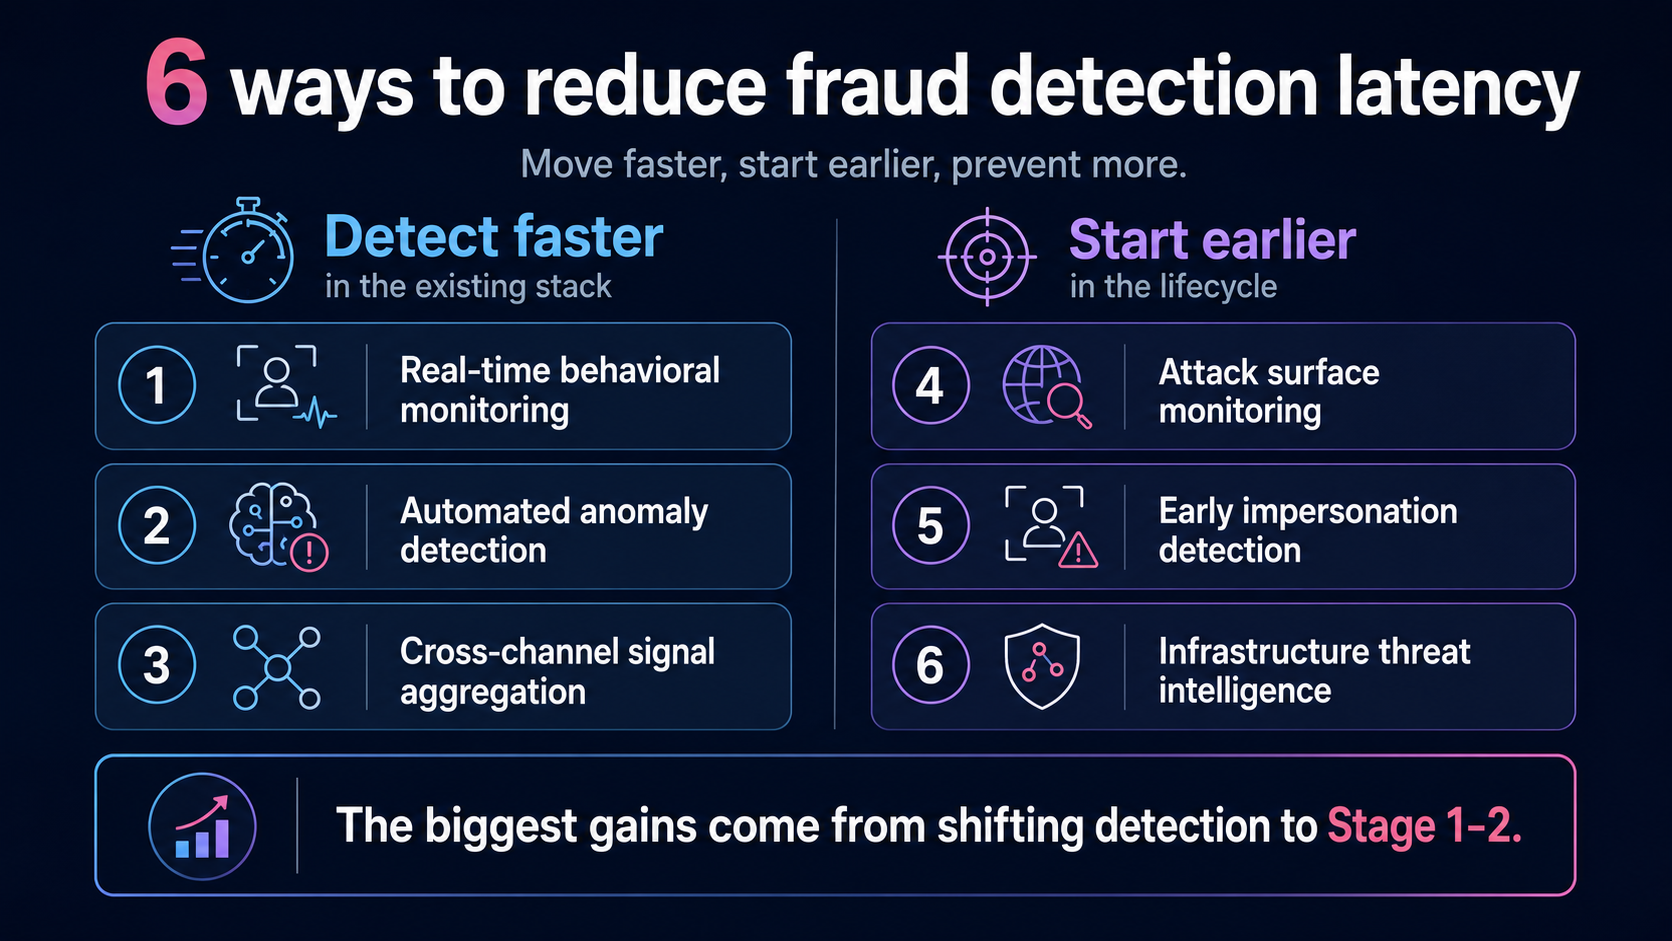
6 Proven Ways to Reduce Fraud Detection Latency
Most fraud teams treat detection latency as a speed problem. It’s actually a position problem.
The six tactics below are ordered deliberately, from downstream to upstream. The first three improve how fast you detect fraud within the transaction layer you already operate. The last three move your detection starting point earlier in the attack lifecycle, before credentials are harvested and before your customers are exposed.
As the World Economic Forum noted in 2025, embedding detection into infrastructure rather than relying on post-event signals is the shift that actually changes outcomes.
Tactics 1 through 3 reduce your mean time to detect. Tactics 4 through 6 reduce the number of attacks that ever reach the detection window at all.
That’s the difference between moving faster and starting earlier.
Step 1: Implement Real-Time Behavioral Monitoring
Most fraud controls wait for a transaction to fire. Behavioral monitoring moves the trigger earlier, to the session itself.
By analyzing how a user interacts with your platform in real time, behavioral monitoring surfaces anomalies before a fraudster reaches checkout. The signals to watch:
- Session velocity anomalies – login attempts or navigation sequences that move faster than any human would
- Device fingerprint changes – a known account suddenly appearing from an unrecognized device or browser configuration
- Navigation pattern deviations – skipping steps, jumping directly to high-value pages, or ignoring content a genuine user would engage with
- Typing and interaction biometrics – keystroke rhythm, mouse movement, and tap pressure that don’t match the account’s behavioral baseline
When these signals fire before a transaction executes, you recover minutes to hours of detection time. That’s the difference between blocking a fraudulent transfer and investigating one.
IBM’s fraud prevention framework highlights how real-time anomaly detection enables adaptive controls, like step-up verification, before access is granted, not after damage is done.
The honest limitation: behavioral monitoring still operates at Stage 4 of the fraud lifecycle. Credentials have already been harvested. You’re catching the attacker at the door, not before they built it.
Step 2: Deploy Automated Anomaly Detection to Eliminate Manual Triage Bottlenecks
In mature fraud operations, the biggest contributor to detection latency often isn’t the alert itself. It’s the gap between when the alert fires and when an analyst actually looks at it.
Manual triage is the bottleneck. Queues stack up, analysts context-switch, and high-confidence signals sit idle while lower-priority noise gets reviewed first. Every minute of that delay is an open window.
Automated anomaly detection closes that window by removing the human handoff from the critical path:
- ML-based scoring ranks alerts by fraud confidence the moment they’re generated, so high-risk events surface immediately
- Automated case creation pulls in enrichment data, device signals, session history, and account context before an analyst opens the ticket
- Threshold-based auto-action triggers holds or step-up authentication on the highest-risk events without waiting for human review
The impact is measurable. Research published in the International Journal of Scientific Research and Analysis found that automated response protocols reduced MTTD by 82% and MTTR by 71% compared to manual workflows.
That’s not a marginal improvement. It’s structural, and it comes from removing the manual triage step entirely, not from tuning it.
Step 3: Aggregate Cross-Channel Signals to Surface Attack Patterns Earlier
Attackers don’t stay in one lane. A coordinated fraud campaign typically spans email phishing, spoofed web pages, and mobile lure pages, often running simultaneously. When your teams monitor each channel in isolation, you’re watching fragments of a picture that only makes sense when assembled.
Cross-channel signal aggregation connects those fragments. Correlating login anomalies with active phishing campaign signals, linking device fingerprints across web and mobile sessions, and matching authentication failures against known attacker infrastructure surfaces coordinated attack patterns that single-channel monitoring can’t see.
Instead of catching individual suspicious transactions, you’re identifying the attack wave itself, before it fully materializes across your customer base.
The scale of coordinated attacks makes this urgent. TransUnion’s H2 2025 Top Fraud Trends report found a 26% increase in suspected digital fraud for account creation attempts from H1 2024 to H1 2025. These aren’t isolated incidents. They’re coordinated campaigns hitting multiple touchpoints at once.
When signals are siloed, analysts chase individual events. When signals are aggregated, a single campaign pattern triggers earlier awareness, compressing the time between attacker action and defender response.
Step 4: Monitor Your Attack Surface Continuously for Infrastructure Setup
This is where the framework fundamentally changes. Steps 1 through 3 make you faster inside the transaction layer. Step 4 moves you out of it entirely.
Continuous attack surface monitoring detects attacker preparation before impersonation goes live. That means scanning newly registered domains for brand similarity, monitoring certificate transparency (CT) logs for lookalike SSL certificates, and tracking hosting infrastructure tied to known fraud actors. When an attacker registers `yourbank-secure-login.com` and provisions an SSL certificate, that activity is publicly visible in CT logs within minutes of issuance. You don’t need to wait for a customer to fall for it.
The scale of the problem makes this non-negotiable. Interisle Consulting Group’s Phishing Landscape 2025 found that over 1.5 million domain names were used in phishing attacks in a single year, a 38% increase over the prior year, with 77% maliciously registered by cybercriminals. Attackers are building infrastructure at industrial scale. Manual brand monitoring can’t keep pace.
Automated scanning closes that gap. By continuously comparing newly registered domains against your brand’s naming patterns, logos, and digital assets, you surface suspicious infrastructure at Stage 1 of the fraud lifecycle, hours after registration, not days after customers start reporting fake sites.
Post-transaction detection means the credential harvesting window has already closed around your customers. Pre-impersonation detection recovers that entire window. You’re no longer measuring MTTD in days. You’re measuring it in hours, before a single victim has been exposed.
Step 5: Detect Impersonation and Clone Sites at Stage 1-2, Before Credential Harvesting Begins
Speed here isn’t measured in days. It’s measured in minutes.
According to the BlackBerry Global Threat Intelligence Report, the average phishing site lives for under 12 hours. The Verizon DBIR 2025 found that the median time for a victim to click a phishing link is just 21 seconds. That’s the window your team is working against.
Early-stage impersonation detection closes that window before it opens. Instead of waiting for victim reports or transaction anomalies, this capability monitors for the infrastructure attackers build at Stage 1 and 2: newly registered lookalike domains, cloned brand assets, and live phishing pages mimicking your web properties.
When a clone site is flagged within minutes of going live, your response options expand:
- Warn customers before a single credential is submitted
- Initiate takedown while the site is still active
- Alert authentication systems to treat incoming sessions with elevated suspicion
- Feed the impersonation signal into SIEM and anti-fraud tooling for immediate correlation
This is where platforms like Memcyco deliver a qualitatively different capability. Rather than scanning for known-bad indicators after the fact, Memcyco infiltrates live attacks in real time, providing granular visibility into impersonating assets and identifying individual victims as attacks unfold. The result is near-zero MTTD for live impersonation events.
Visual similarity detection for clone sites and monitoring of phishing campaign distribution channels extend this coverage further upstream. Detection at Stage 1 or 2 doesn’t just reduce MTTD. It eliminates the credential harvesting stage entirely.
Step 6: Use Infrastructure-Level Threat Intelligence as Leading Indicators
Most fraud detection tools tell you what already happened. Infrastructure-level threat intelligence tells you what’s about to.
Attackers leave a trail before they ever reach your customers. Domain registrations that mimic your brand, SSL certificates issued for lookalike URLs, hosting provider patterns tied to known fraud actor infrastructure – these are detectable signals that precede credential harvesting by days, sometimes weeks. The question is whether your detection stack is listening for them.
As Frost & Sullivan noted in February 2026, enterprises can’t protect against modern fraud attacks with reactive, traditional FDP solutions. Infrastructure intelligence is what closes that gap.
Here’s how it shifts your detection timing:
- Domain registration monitoring flags attacker-registered lookalike domains at Stage 1, before impersonation goes live
- SSL certificate transparency logs surface newly issued certificates for spoofed brand assets, a reliable pre-attack signal
- Hosting provider and IP fingerprinting correlates new infrastructure to known fraud actor patterns, enabling pre-positioning of defenses
- API integration into SIEM and anti-fraud systems feeds these upstream signals into your existing stack without replacing it
That last point matters. You don’t need to rebuild your detection architecture. Platforms like Memcyco provide APIs for SIEM integration that pipe infrastructure-level signals directly into existing workflows, shifting the detection trigger from “attacker has reached our customers” to “attacker is building infrastructure to reach our customers.”
That shift recovers the maximum possible detection time in the fraud lifecycle.
How to Measure Fraud Detection Latency: A Practical Framework
You can’t reduce what you’re not measuring from the right starting point.
Most fraud teams track alert-to-investigation time. That captures only the last mile. The real gap sits between the moment an attacker acts and the moment your team becomes aware, and that gap is far wider than most dashboards show. According to IBM’s Cost of a Data Breach 2025 report, organizations take an average of 241 days to identify and contain a breach. Detection and escalation alone costs $1.47 million per incident.
Four metrics every fraud and risk team should track:
- Baseline detection latency – average time from attacker action (domain registration, phishing launch) to first alert
- Alert-to-investigation time – how long between alert firing and analyst engagement
- Rolling dwell time – how detection latency trends as controls mature
- Pre-compromise detection rate – the share of attacks caught at Stage 1 or 2, before credential harvesting begins
That last metric is the one that matters most.
Metric 1: Baseline Detection Latency
Most fraud teams think they know their detection time. They’re measuring the wrong clock.
Baseline detection latency is the average time between the earliest confirmed attacker action, whether that’s domain registration, phishing campaign launch, or first credential submission, and your organization’s first awareness of the attack. It’s not the gap between alert and investigation. It’s the gap between attacker and defender.
To calculate it, pull a sample of confirmed fraud cases and work backwards. Identify the earliest evidence of attacker activity: WHOIS registration timestamps, phishing report logs from APWG, or threat intelligence feed entries. Then measure the distance to your first detection event. That gap is your true MTTD, and it’s almost always longer than teams expect. The IBM Cost of a Data Breach Report 2025 puts the average detection time for a phishing compromise at over 200 days. That’s not a tooling gap. That’s a structural blind spot.
Useful data sources for this calculation include:
- Domain registration timestamps (WHOIS or passive DNS logs)
- Phishing report timestamps from threat intelligence feeds
- Customer complaint records tied to confirmed fraud cases
- Internal fraud case timelines with earliest-known attacker activity noted
Once teams see this baseline, the urgency to move detection upstream becomes self-evident.
Metric 2: Alert-to-Investigation Time
An alert firing is not the same as an analyst acting on it. Alert-to-investigation time measures the elapsed gap between a detection system generating an alert and an analyst beginning active investigation. That gap is where wasted hours accumulate.
This metric captures the queue-management component of MTTD. Alert prioritization delays, manual triage workflows, and sheer volume all compound the wait. According to a 2025 survey of 282 security leaders reported by The Hacker News, an average of 56 minutes passes before anyone acts on an alert, and full investigation takes roughly 70 minutes on top of that. For fraud teams, that’s a window attackers exploit without resistance.
The contrast with automated approaches is sharp:
- Manual triage: alert-to-investigation times measured in hours, driven by queue backlogs and analyst bandwidth
- ML-based alert scoring with automated triage: investigation begins within minutes, with low-confidence alerts deprioritized automatically
Reducing alert-to-investigation time through automation doesn’t change what you detect. It changes how fast you act on what you already know. That’s the fastest way to compress the operational component of MTTD without overhauling your detection architecture.
Metric 3: Rolling Dwell Time Tracking
A single MTTD figure is a snapshot. A rolling dwell time trend is a story.
Rolling dwell time tracking calculates MTTD for each confirmed fraud case and plots it as a 30-day or 90-day rolling average. As you add new detection capabilities, the trend line tells you whether they’re actually moving the needle, or just adding noise.
How to implement it:
- Calculate MTTD for every confirmed fraud case: time from first attacker action (domain registration, phishing launch) to first internal alert
- Plot each case on a rolling 30-day or 90-day average
- Annotate the timeline when new controls go live, so you can attribute any MTTD shift to a specific change
This metric serves two purposes. First, it validates that upstream detection investments are genuinely compressing detection time, not just increasing case volume. Second, it gives you a board-level metric that translates technical improvements into operational impact.
Without rolling tracking, you can’t distinguish between genuine MTTD reduction and a shift in attack mix or case volume. The IBM 2025 Cost of a Data Breach Report found organizations took a mean of 241 days to identify and contain a breach. If your rolling average is trending toward that benchmark, the data tells you exactly where to act.
Metric 4: Pre-Compromise Detection Rate
This is the metric that separates genuinely proactive fraud teams from teams that have simply gotten faster at being reactive.
Pre-compromise detection rate measures the percentage of confirmed fraud cases, in a given period, first detected at Stage 1 or 2 of the fraud lifecycle, before any victim submitted credentials to an attacker-controlled asset. It’s a leading indicator of upstream detection maturity, not a lagging measure of damage already done.
The benchmark is blunt:
- 0% pre-compromise detection rate: Your team is entirely reactive. The detection clock starts at Stage 4 or 5, every time.
- 30%+ pre-compromise detection rate: Your team has meaningful upstream visibility. You’re catching attacks while attackers are still building infrastructure.
To calculate it: divide confirmed fraud cases detected before credential harvesting began by total confirmed fraud cases in the same period. Multiply by 100.
The critical caveat: this metric can’t be calculated from transaction monitoring data alone. Transaction data has no visibility into attacker infrastructure. You need signals from domain registration activity, impersonation monitoring, and live attack detection to populate it.
As a March 2026 Regula study confirmed, most organizations still measure fraud prevention backward, tracking chargebacks and losses after the fact. Pre-compromise detection rate forces the measurement forward.
If your rate is 0%, your detection clock starts too late, every time.
The Strategic Shift: Move Detection Upstream
Here’s the uncomfortable truth most fraud teams already sense: your detection tools aren’t slow because they’re bad. They’re slow because they’re pointed at the wrong stage of the attack.
Transaction monitoring, behavioral analytics, post-login controls, all pointed downstream. They fire after credentials are harvested, after accounts are accessed, after funds move. By that point, the attacker has already won the first three rounds.
The question is no longer whether your detection tools are fast enough. It’s whether they’re pointed at the right stage of the attack.
Two postures. One clear gap.
The contrast between reactive and proactive detection isn’t subtle:
Reactive posture (Stage 4-5 detection)
- Detection triggers after credential use or transaction initiation
- MTTD measured in days
- Financial exposure has already materialized
- Investigation, reimbursement, and remediation follow
Proactive posture (Stage 1-2 detection)
- Detection triggers during infrastructure setup or impersonation deployment
- MTTD measured in hours or minutes
- Financial exposure is prevented before it begins
- Victims are identified before they become victims
The gap between these two postures isn’t a technology gap. It’s an architectural one. Most fraud detection stacks are built to answer: “Did something go wrong?” The upstream posture asks a different question: “Is something being built to go wrong?”
The new detection frontier
Impersonation monitoring, domain visibility, and infrastructure-level threat signals represent a category shift in how fraud detection is architected. These aren’t incremental improvements to existing controls. They’re a fundamentally different detection layer, one that operates before your customers ever encounter an attacker.
When a fraudster registers a lookalike domain, clones your brand assets, or deploys a phishing page, they leave signals. Those signals are detectable. Organizations catching attacks at Stage 1 or 2 aren’t doing so because they have faster analysts. They’ve extended their detection perimeter to where attacks actually begin.
Frost & Sullivan recognized this shift in their 2025 analysis, noting that modern fraud moves faster than traditional defenses and that early intervention is the critical variable in reducing the window of exposure.
Memcyco’s platform is built around this upstream paradigm. The results are measurable: near-zero MTTD for live attacks, a 50% reduction in ATO incidents, and up to 90% reduction in investigation time. The CISO of a top-10 North American bank put it plainly: “They took our incident handling times from 72 hours to less than 1 hour and saved us millions every month.”
That’s not a tooling upgrade. That’s a detection architecture that starts at the right stage.
Conclusion: Reduce MTTD by Changing Where You Look, Not Just How Fast You Look
The central argument is simple: MTTD is a lifecycle problem, not a tooling problem. Faster transaction monitoring doesn’t shrink detection latency if you’re still starting the clock at Stage 4. The financial exposure window opens the moment an attacker registers a domain and clones your brand. It doesn’t wait for a transaction anomaly to fire.
The five-stage fraud lifecycle makes this concrete. Most teams gain visibility at Stage 4 or 5, after credentials are already harvested and accounts are already compromised. The six tactics covered here offer a path forward, but tactics 4 through 6 carry the real weight: attack surface monitoring, impersonation detection, and infrastructure-level threat intelligence. These capabilities shift your detection starting point from post-execution to pre-compromise. That’s not an incremental improvement. It’s a structural one.
The IBM Cost of a Data Breach Report 2025 puts the average breach lifecycle at 241 days. Every day of undetected attacker activity is a day your customers are exposed. Start measuring what matters: baseline detection latency, alert-to-investigation time, rolling dwell time, and pre-compromise detection rate. That last metric is your leading indicator. If it’s near zero, your detection posture is still reactive.
If your detection framework starts at transaction review, it starts too late. The financial exposure window opens at Stage 1 and closes only when you can see it.
If Detection Starts at Transaction Review, It Starts Too Late
By the time a transaction anomaly fires, attackers have already built infrastructure, launched impersonation campaigns, and harvested credentials. The financial exposure isn’t created at Stage 4. It’s created at Stage 1, when no one is watching.
The shift is clear: move detection upstream, to where attacks are built, not where they land.
Frost & Sullivan concluded that when defenses intervene has become more critical than which controls are deployed, and spotlighted Memcyco’s preemptive approach as the model for earlier, more adaptive fraud defense. Memcyco platform delivers near-zero mean time to detection for live attacks, a 50% reduction in ATO incidents, and up to 90% reduction in investigation time.
The next step isn’t another transaction monitoring layer. It’s visibility at the stages that actually drive your MTTD.
See how upstream detection stops account takeover before credentials are used.
Conclusion
Most fraud detection programs are optimized for speed at the wrong stage. The financial exposure isn’t created when a transaction anomaly fires. It’s created when attacker infrastructure goes live and no one is watching. Reducing MTTD means changing where detection starts, not just how fast analysts respond once an alert appears. Move detection to Stage 1 and Stage 2, track pre-compromise detection rate as your leading indicator, and the downstream damage largely doesn’t materialize.
If Detection Starts at Transaction Review, It Starts Too Late
Learn how early-stage digital threat detection reduces fraud exposure before attacks reach your customers. Explore how Memcyco’s platform delivers near-zero MTTD by detecting impersonation infrastructure at Stage 1 and 2 of the fraud lifecycle.
See How Upstream Detection Works
FAQs
Q: What is mean time to detect (MTTD) in fraud detection?
A: In digital fraud detection, MTTD (mean time to detect) measures the average elapsed time between the moment an attacker begins executing an attack and the moment the defending organization first becomes aware of it. Unlike occupational fraud MTTD – which the ACFE 2024 Report to the Nations found averages 12 months for internal fraud – digital fraud MTTD operates on a much shorter timescale. The challenge is that most organizations measure MTTD from alert-to-investigation, not from attacker action to first awareness, which dramatically understates the true detection gap.
Q: Why does fraud detection latency remain high even with mature detection controls?
A: Detection latency remains high because most fraud detection controls are structurally downstream – they are designed to fire at transaction execution (Stage 4 of the fraud lifecycle), not at infrastructure setup or impersonation deployment (Stages 1-2). This means that even highly optimized transaction monitoring cannot reduce MTTD below the point of transaction execution. The attacker has already completed credential harvesting before the first alert fires. Reducing MTTD fundamentally requires moving detection upstream, not just making downstream detection faster.
Q: What is the difference between fraud detection latency and alert-to-investigation time?
A: Alert-to-investigation time measures the operational gap between when an alert fires and when an analyst begins investigating it. Fraud detection latency is the broader metric that measures the gap between attacker action and organizational awareness – which includes the time before any alert fires at all. Most teams focus on reducing alert-to-investigation time, which addresses only the last mile of detection latency. The larger and more impactful gap is the time between attacker infrastructure setup and first detection signal, which can span days or weeks.
Q: How can fraud teams detect attacks before credentials are harvested?
A: Pre-compromise detection requires visibility into attacker infrastructure – specifically, the ability to detect domain registration, clone site deployment, and phishing campaign launch before victims interact with fraudulent assets. This involves continuous attack surface monitoring for lookalike domains, real-time website monitoring for brand impersonation, and infrastructure-level threat intelligence that identifies attacker preparation activity. Technologies like Memcyco’s platform infiltrate live attacks and provide real-time visibility into impersonating assets and individual victims, enabling detection at Stage 1 or 2 of the fraud lifecycle rather than Stage 4 or 5.
Q: What metrics should fraud teams track to measure and reduce MTTD?
A: Four metrics provide a complete picture of fraud detection latency: (1) Baseline detection latency – average time from confirmed attacker action to first organizational awareness; (2) Alert-to-investigation time – elapsed time between alert firing and analyst engagement; (3) Rolling dwell time tracking – a continuous trend metric that validates whether detection improvements are actually reducing MTTD over time; (4) Pre-compromise detection rate – the percentage of attacks detected at Stage 1 or 2, before credential harvesting begins. The pre-compromise detection rate is the leading indicator that distinguishes genuinely proactive fraud detection postures from reactive ones.
Q: How does impersonation monitoring reduce fraud detection time?
A: Impersonation monitoring detects fraudulent clone sites and spoofed brand assets at Stage 1 or 2 of the fraud lifecycle – before victims interact with them. Because phishing sites have an average lifespan of under 12 hours (BlackBerry Global Threat Intelligence Report), speed of detection at this stage is measured in minutes. When a clone site is detected within minutes of going live, organizations can warn customers, initiate takedown, and alert authentication systems before a single credential is submitted – recovering the entire credential harvesting and account takeover window that would otherwise remain open until a transaction anomaly fires.
Q: What is the financial impact of high fraud detection latency?
A: High fraud detection latency directly translates to financial exposure: every hour of dwell time is an open window for credential use, account takeover, and transaction fraud. ATO fraud cost US adults approximately $15.6 billion in 2024, a 23% increase year-over-year (Javelin Strategy & Research, 2025). IBM’s Cost of a Data Breach Report 2024 found phishing-related breaches take an average of 261 days to identify and contain, with an average breach cost of $4.88 million. Organizations that detect attacks at Stage 1-2 rather than Stage 4-5 prevent financial exposure from materializing rather than reimbursing it after the fact.

Digital Impersonation Fraud Specialist